Arctic Communities - Oceans - STEM Challenge

Sea Level Rise Stem Activity
As the Earth’s atmosphere warms, sea, and land ice are melting at an accelerated rate. The melting ice creates problems for both wildlife and humans. Some of this ice melt contributes to rising sea levels which creates new challenges for communities that are situated close to the shoreline, especially in the Arctic. In this activity, we will discover what is a greater contributor to sea-level rise - the melting of sea ice (e.g: icebergs and shore-fast ice) or the melting of land ice (e.g: glaciers and ice sheets).
Materials:
2 identical, clear containers
Small rocks or clay (enough to fill approximately a quarter of each container)
Ice cubes
Ruler
Water
Permanent Marker
Watch
The Activity
Divide the clay or rocks into two equal parts
Place the rocks or clay on one side of each of the containers. This will represent land.
Label one container Sea Ice and the other Land Ice
In the Land Ice container place as many ice cubes as possible on top of the rocks.
Place the same number of ice cubes in the empty space in the Sea Ice container.
Pour water into the Sea Ice container.
Make sure that all of the ice cubes are floating and none are resting on the bottom and that the water level isn’t higher than the land.
Pour water into the Land Ice container so that it is at the same level as the Sea Ice container
Make a mark on the side of each container marking the height of the water levels.
If you are using a plastic container the ink from the marker may not wash off. You could use a piece of clear tape and make your mark on the tape.
Have students predict which ice they believe will melt the fastest
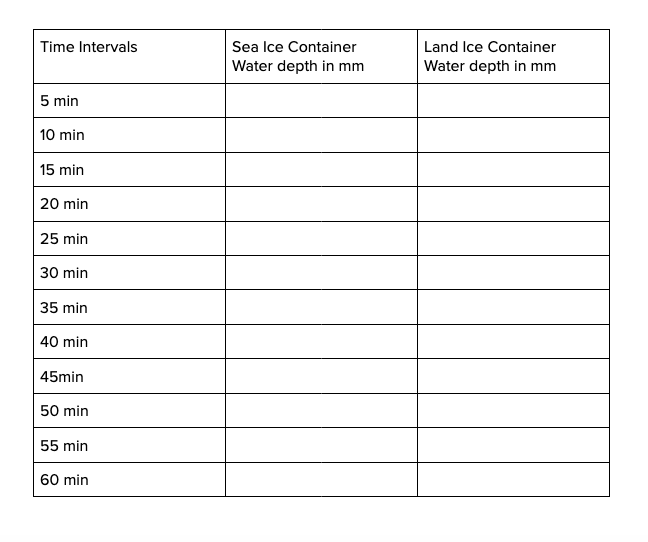
Now observe what happens. Using the chart provided or in a note book record your observations. Every 5 minutes measure and record the depth of the water in each of the containers.
When all of the ice cubes have melted and you have made your final measurements you can chart your findings in the graph provided. Chart the results from both containers on the same graph so that you can compare the results.
Observations
Haven’t got Live It yet? Click here to create your account today and get your first 2 months free!
If you’re a BC K-7 teacher, click here for your open access to Live It Earth thanks to a deal with Focused Education Resources.